
Search Console screenshot · 30 Jun–29 Sep 2026.
eFootballLAB · Featured Case Study
164,000 Google AI Overview appearances. 13.6k ChatGPT views.
These results belong to one website only: efootballlab.com. Explore three months of UTM-attributed traffic and Google AI Overview appearances, original screenshots, and exact daily crawler data.
UTM-Attributed ViewsEvidence-Based
One website · efootballlab.com
Three months of measurable AI discovery.
All figures in this study belong to one website only: efootballlab.com. Google AI Overview appearances, UTM-attributed views, and crawler requests each keep their own source and measurement period.
UTM source report · three months · rounded display.
Share displayed in the supplied UTM source breakdown.
Crawler overview screenshot · three months · rounded display.
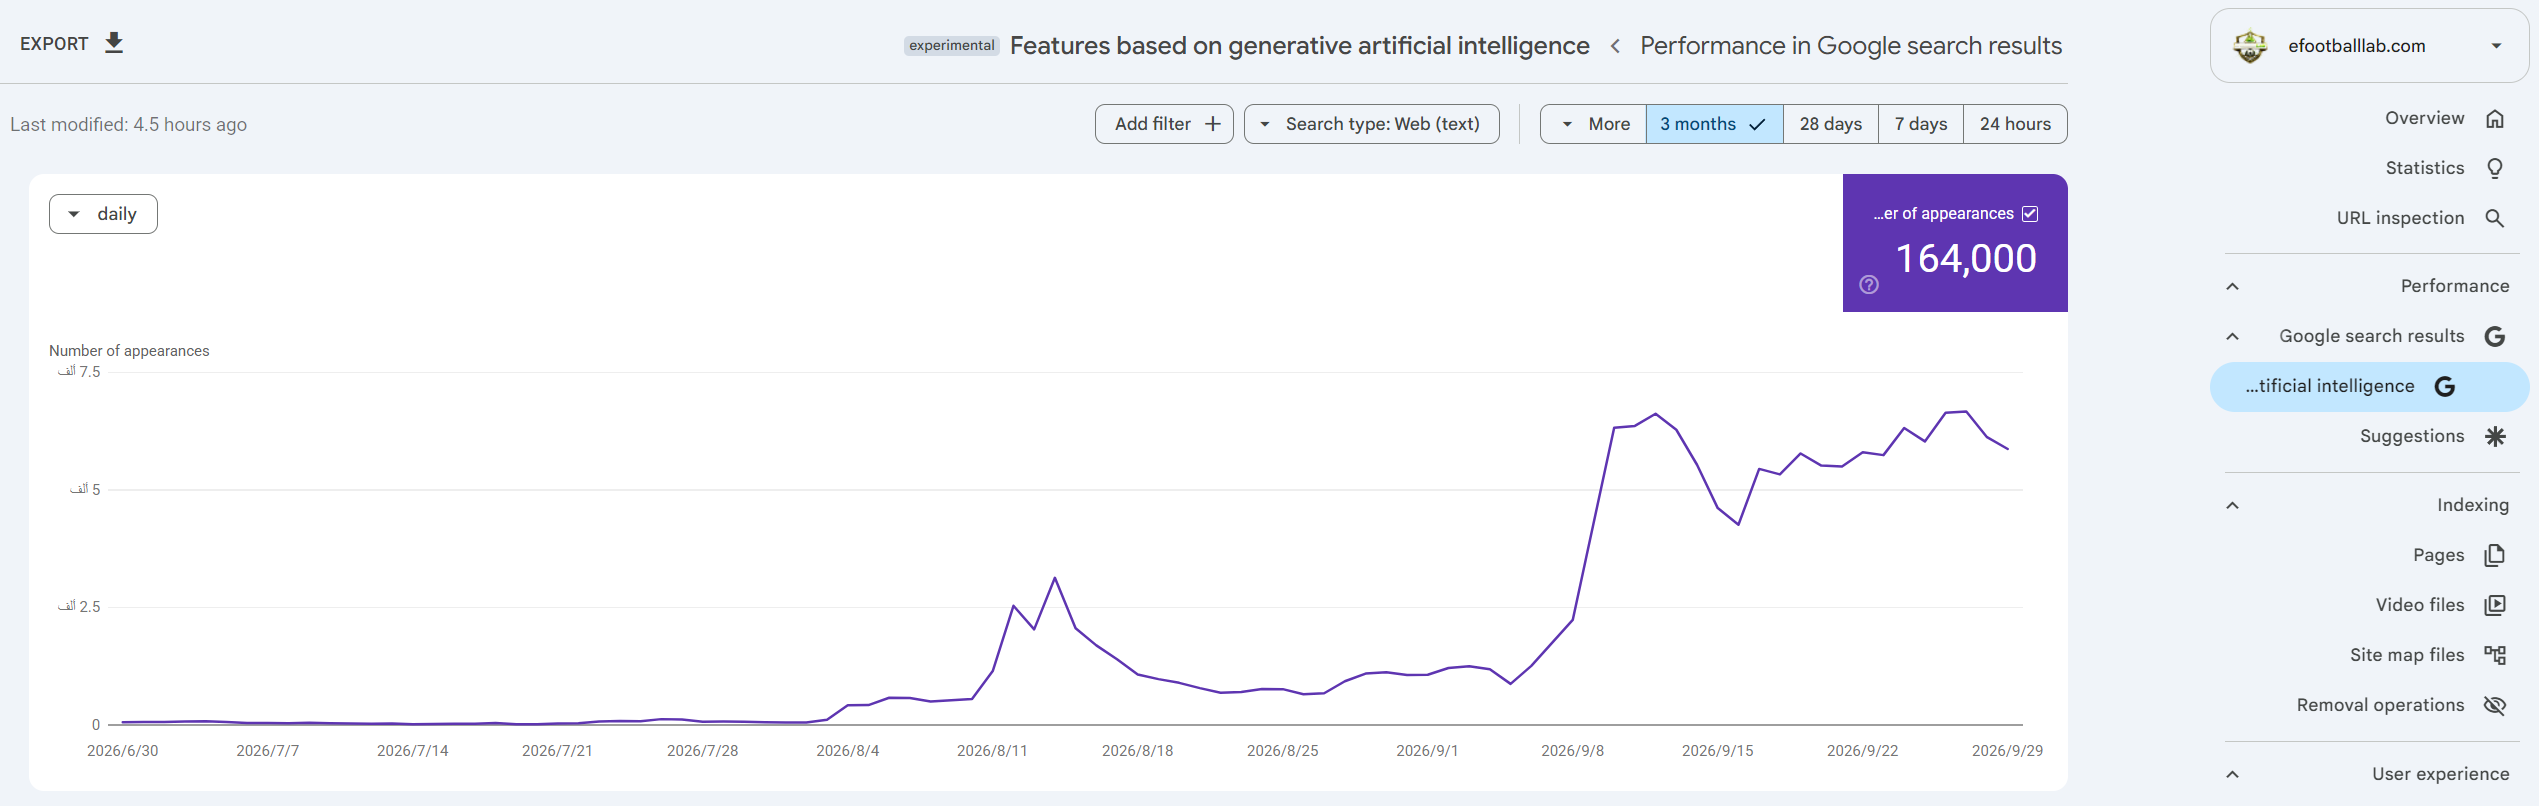
The daily line rises during August and reaches a higher range in September. The screenshot supplies the trend; no daily Google values have been reconstructed.
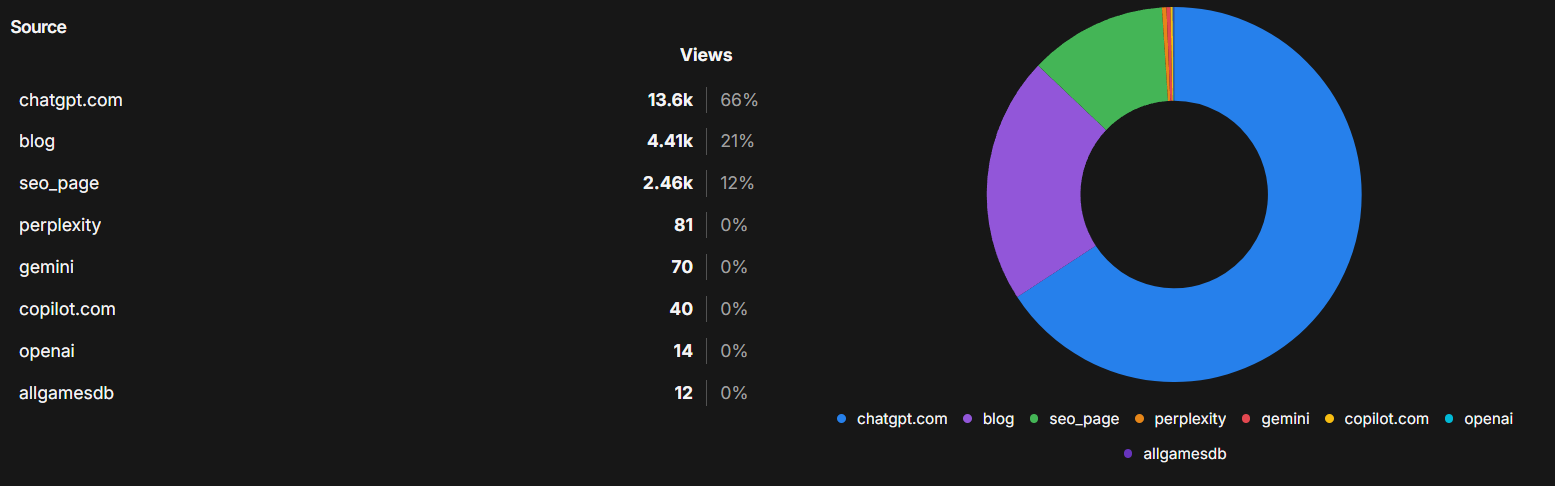
13.6k views, accounting for the displayed 66%. These are UTM-attributed views, not unique visitors or sessions.
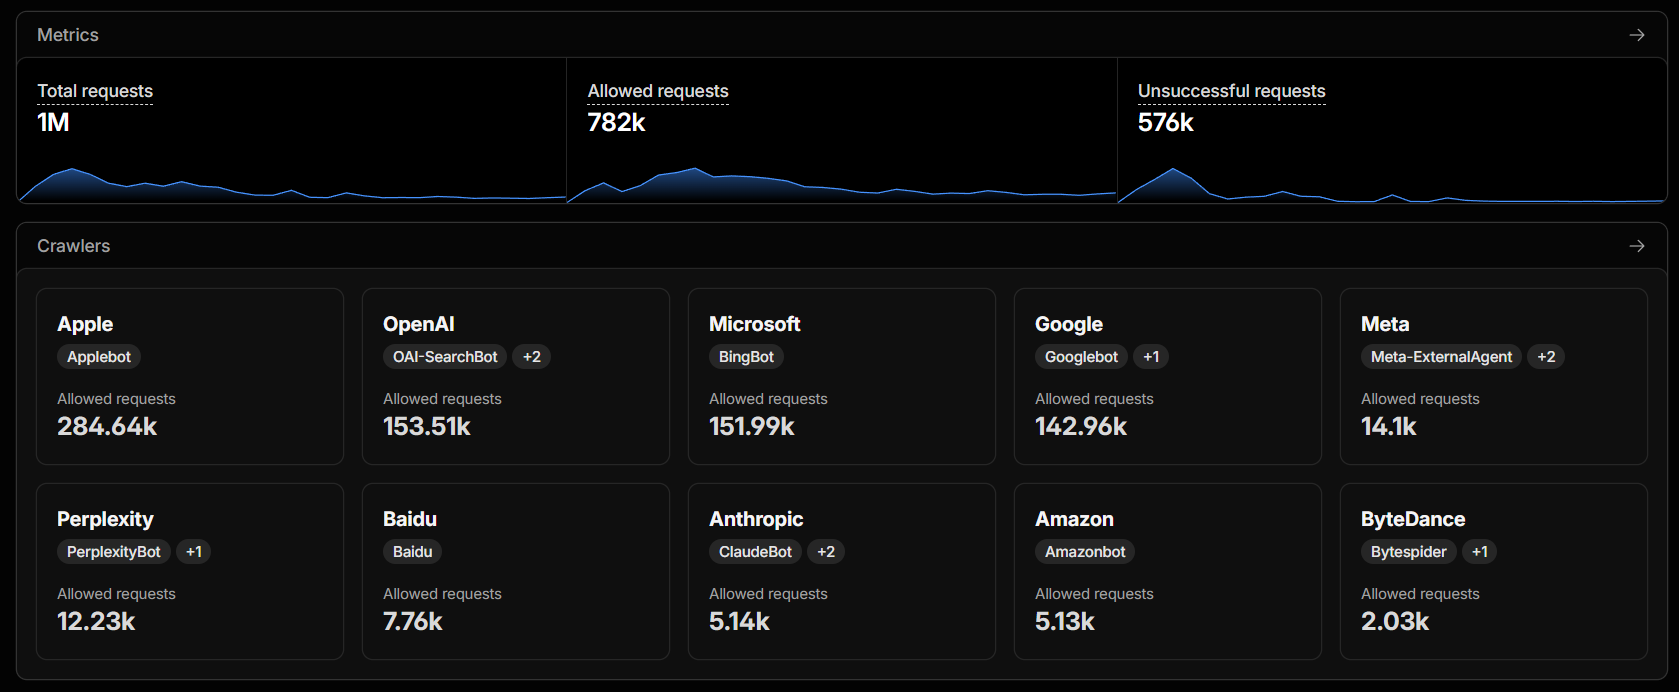
The screenshot shows 1M total, 782k allowed, and 576k unsuccessful requests. These provider metrics are not added together or treated as disjoint categories.
Website: efootballlab.com only. Owner-supplied evidence received 3 October 2026. UTM and crawler screenshots cover three months, as confirmed by the owner. Rounded labels are preserved exactly as shown. Click any image to inspect the original.
01 · Google AI Overview
164,000 appearances over three months.
The supplied Google Search Console report shows Google AI Overview appearances for eFootballLAB between 30 June and 29 September 2026. The chart starts close to zero and rises visibly in August and September.
| Signal | Observed value | What it means |
|---|---|---|
| Google AI Overview appearances | 164,000 | The total displayed in the supplied Search Console screenshot. |
| Selected period | 30 Jun–29 Sep 2026 | Three-month view, with dates visible on the chart. |
| Daily pattern | Higher activity in September | A visual observation from the screenshot; exact daily values were not supplied. |
Appearances measure visibility in this Google report. They do not measure clicks, unique users, or AI-platform referral traffic. A comparable before/after export is needed to calculate a growth percentage or attribute the change to a specific intervention.
Inspect the Google AI Overview screenshot ↗02 · UTM-attributed views
ChatGPT accounts for 66% of the shown source views.
The owner-confirmed three-month UTM report shows 13.6k views attributed to chatgpt.com. Blog and SEO-page campaigns appear alongside smaller AI sources in the same source breakdown.
Source labels and rounded view counts are retained from the original screenshot. Shares below 1% were rounded to 0% there and are shown as <1% here. Bars compare each source with ChatGPT using the displayed counts; they are approximate. “blog”, “seo_page”, and “allgamesdb” are kept as separate campaign sources.
How these views are attributed
These figures use the UTM source report selected by the owner. They represent views, not deduplicated visitors or sessions. The JavaScript referrer export undercounts this traffic according to the owner, so it is excluded from the current study. No exact total is reconstructed from the rounded “k” labels.
03 · Crawler access
782k allowed requests in the three-month overview.
The overview includes Apple, OpenAI, Microsoft, Google, Meta, Perplexity, Anthropic, and other providers. Its rounded totals describe crawler requests, separately from the UTM traffic report.
Rounded three-month screenshot total.
Rounded three-month screenshot total.
Provider status metric; not equated with blocked requests.
Allowed and unsuccessful requests are shown as separate provider metrics. Their categories may overlap, so these numbers are not added into a total or used to calculate a success rate.
Inspect the crawler overview screenshot ↗04 · Exact CSV counts · efootballlab.com only
727,359 requests across 31 daily rows.
The crawler CSV for efootballlab.com covers 2 September–2 October 2026, a shorter period than the three-month screenshot. It contains exact daily counts for 23 named crawlers, with no response-status fields.
Linear scale: bottom gridline 0; top gridline 55,159 requests. The export records zero on 2 September; it is retained as supplied.
| Crawler | Requests | Share of CSV total |
|---|---|---|
| Applebot | 281,406 | 38.69% |
| BingBot | 137,060 | 18.84% |
| Googlebot | 127,187 | 17.49% |
| OAI-SearchBot | 124,878 | 17.17% |
| ChatGPT-User | 15,041 | 2.07% |
| Meta-ExternalAgent | 13,921 | 1.91% |
| PerplexityBot | 12,019 | 1.65% |
| Baidu | 6,233 | 0.86% |
| ClaudeBot | 3,847 | 0.53% |
| Bytespider | 1,543 | 0.21% |
| Amazonbot | 1,386 | 0.19% |
| DuckAssistBot | 1,041 | 0.14% |
| Claude-User | 821 | 0.11% |
| PetalBot | 536 | 0.07% |
| CCBot | 203 | 0.03% |
| Manus Bot | 156 | 0.02% |
| TikTok Spider | 51 | 0.01% |
| archive.org_bot | 9 | 0.00% |
| MistralAI-User | 9 | 0.00% |
| Claude-SearchBot | 7 | 0.00% |
| GPTBot | 2 | 0.00% |
| Perplexity-User | 2 | 0.00% |
| Google-CloudVertexBot | 1 | 0.00% |
| Total | 727,359 | 100% |
Show all 31 daily rows
| Date | All requests | OAI-SearchBot | ChatGPT-User |
|---|---|---|---|
| 2026-09-02 | 0 | 0 | 0 |
| 2026-09-03 | 17,891 | 1,692 | 713 |
| 2026-09-04 | 26,375 | 2,380 | 1,580 |
| 2026-09-05 | 15,335 | 2,274 | 1,180 |
| 2026-09-06 | 25,559 | 5,689 | 1,130 |
| 2026-09-07 | 43,608 | 4,533 | 1,252 |
| 2026-09-08 | 48,659 | 4,874 | 1,060 |
| 2026-09-09 | 55,159 | 4,877 | 926 |
| 2026-09-10 | 41,362 | 4,156 | 419 |
| 2026-09-11 | 43,034 | 2,933 | 623 |
| 2026-09-12 | 41,959 | 5,452 | 889 |
| 2026-09-13 | 38,676 | 4,049 | 856 |
| 2026-09-14 | 34,792 | 3,507 | 729 |
| 2026-09-15 | 25,143 | 3,351 | 697 |
| 2026-09-16 | 23,957 | 3,257 | 624 |
| 2026-09-17 | 21,412 | 3,186 | 229 |
| 2026-09-18 | 16,399 | 3,707 | 217 |
| 2026-09-19 | 15,265 | 4,105 | 144 |
| 2026-09-20 | 20,912 | 4,462 | 166 |
| 2026-09-21 | 17,617 | 3,674 | 168 |
| 2026-09-22 | 13,422 | 4,311 | 140 |
| 2026-09-23 | 15,070 | 5,142 | 118 |
| 2026-09-24 | 14,158 | 4,917 | 224 |
| 2026-09-25 | 18,785 | 7,048 | 123 |
| 2026-09-26 | 16,005 | 5,853 | 103 |
| 2026-09-27 | 11,973 | 2,461 | 111 |
| 2026-09-28 | 12,519 | 4,986 | 99 |
| 2026-09-29 | 12,771 | 3,855 | 88 |
| 2026-09-30 | 11,286 | 4,218 | 79 |
| 2026-10-01 | 13,434 | 4,792 | 164 |
| 2026-10-02 | 14,822 | 5,137 | 190 |
Requests reflect crawler activity, not people, citations, or recommendations. Named search, training, and user-retrieval agents remain separate. This CSV does not identify which requests were allowed, blocked, or successful.
Download the original crawler CSV ↓
Context
The challenge
When a website already has many pages, the next step is rarely obvious.
Some pages may have impressions but weak positions. Others may have useful topics but unclear search intent. Some may need stronger internal linking, while others may need technical cleanup before more content is added.
The real question becomes: what should be improved first?
Workflow
The workflow
Review existing search signals
Look at pages, queries, impressions, clicks, click-through rate, and average position.
Identify opportunity pages
Find pages that already show signs of demand but are not yet performing as strongly as they could.
Compare page intent with search intent
Check whether the page actually answers the question users are trying to solve.
Check technical and structural gaps
Review canonicals, crawlability, internal linking, page clarity, and content structure.
Build an action order
Prioritize improvements before creating more pages without a clear purpose.
Prioritization
What this helps reveal
Find pages that already have search signals and may deserve focused work.
Identify topics where the current page does not fully answer the user’s likely intent.
Separate content problems from crawl, canonical, and page-structure issues.
Turn scattered data into an ordered list of next actions.
Why it matters
More content is not always the answer.
For an established website, improving the right existing page can be more useful than publishing several new pages without a clear reason. Search data helps reveal where there is already demand. Technical and content review helps determine what is blocking progress.
Next signals
What is being monitored next
The current evidence documents the outcome across three separate channels. Next, compare matching time windows for Google AI Overview appearances, UTM-attributed views, and search-crawler requests. Publish growth percentages only when equivalent before/after measurements are available.
Monitoring in progress
The supplied data shows discovery and traffic activity. It does not isolate the impact of any one optimization or establish a causal lift.
Evidence standards
How we document these studies
We separate what was changed, what was observed, and what cannot yet be attributed with certainty. This keeps each study useful without turning incomplete signals into exaggerated claims.
Find the pages that deserve attention first
Use TruboRankAI to connect search data, review page opportunity, and turn website signals into a clearer action plan.