TruboRankAI AI Visibility Infrastructure
Live AI visibility studies

Live AI visibility case studies with real data and charts.

Explore documented SEO, AEO, and GEO experiments from real websites, with referral evidence, crawler analysis, percentage charts, and the workflow behind every result.

These are not invented customer stories or estimated outcomes. Each case study separates observed data from interpretation and shows when its evidence snapshot was published.

Founder-led studies Real websites and real data Clear separation between evidence and assumptions
Real evidence

See the data behind each live case study.

Search, referral, crawler, and answer-engine evidence—kept separate so every chart and conclusion is easier to understand and verify.

24,972 AI-platform visits 5,869 from ChatGPT 1,613 AI-referred pageviews Review the full evidence →
Live analytics charts

Compare AI and crawler activity as percentages.

Three focused comparisons from the latest Admin-published evidence snapshot. Every value is shown as a percentage, so the signal is easy to understand at a glance.

Evidence snapshot manually published 17 September 2026 Create shareable post
Percentage comparison

AI platform activity share

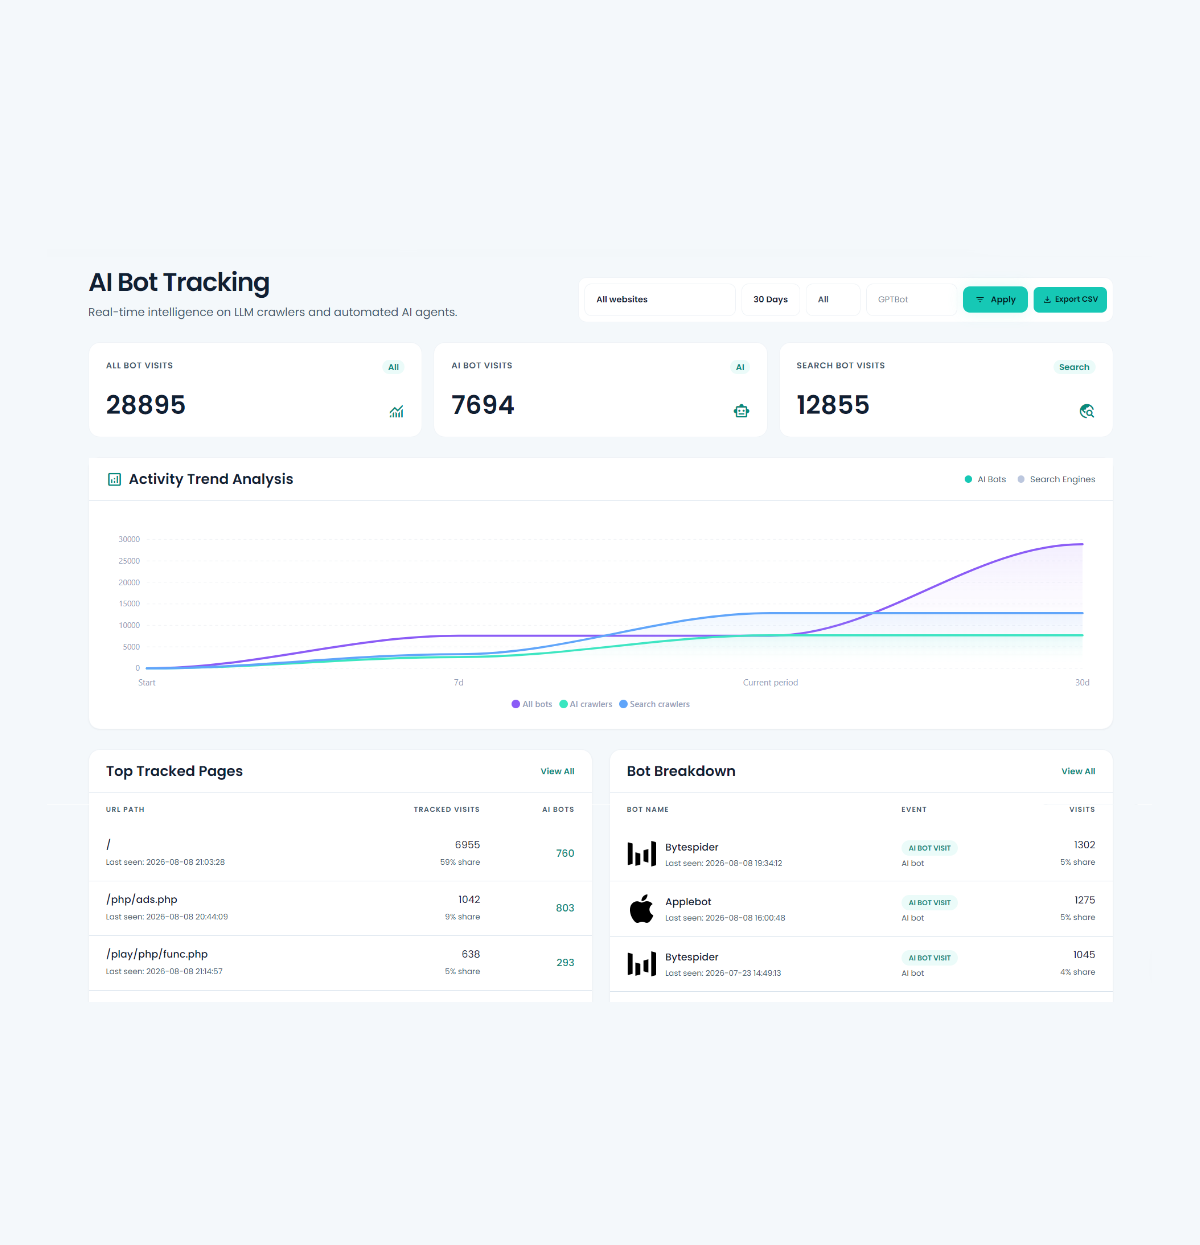
Share of GPT, Claude, Perplexity, spider, and remaining AI activity in the published evidence snapshot.

  • GPT / OpenAI23.5%
  • Claude9.4%
  • Perplexity1.8%
  • Spider bots31.7%
  • Other AI bots33.6%
Percentage comparison

AI bots vs search bots

Relative share of AI-classified and search-classified crawler events.

  • AI bots36.2%
  • Search bots63.8%
Percentage comparison

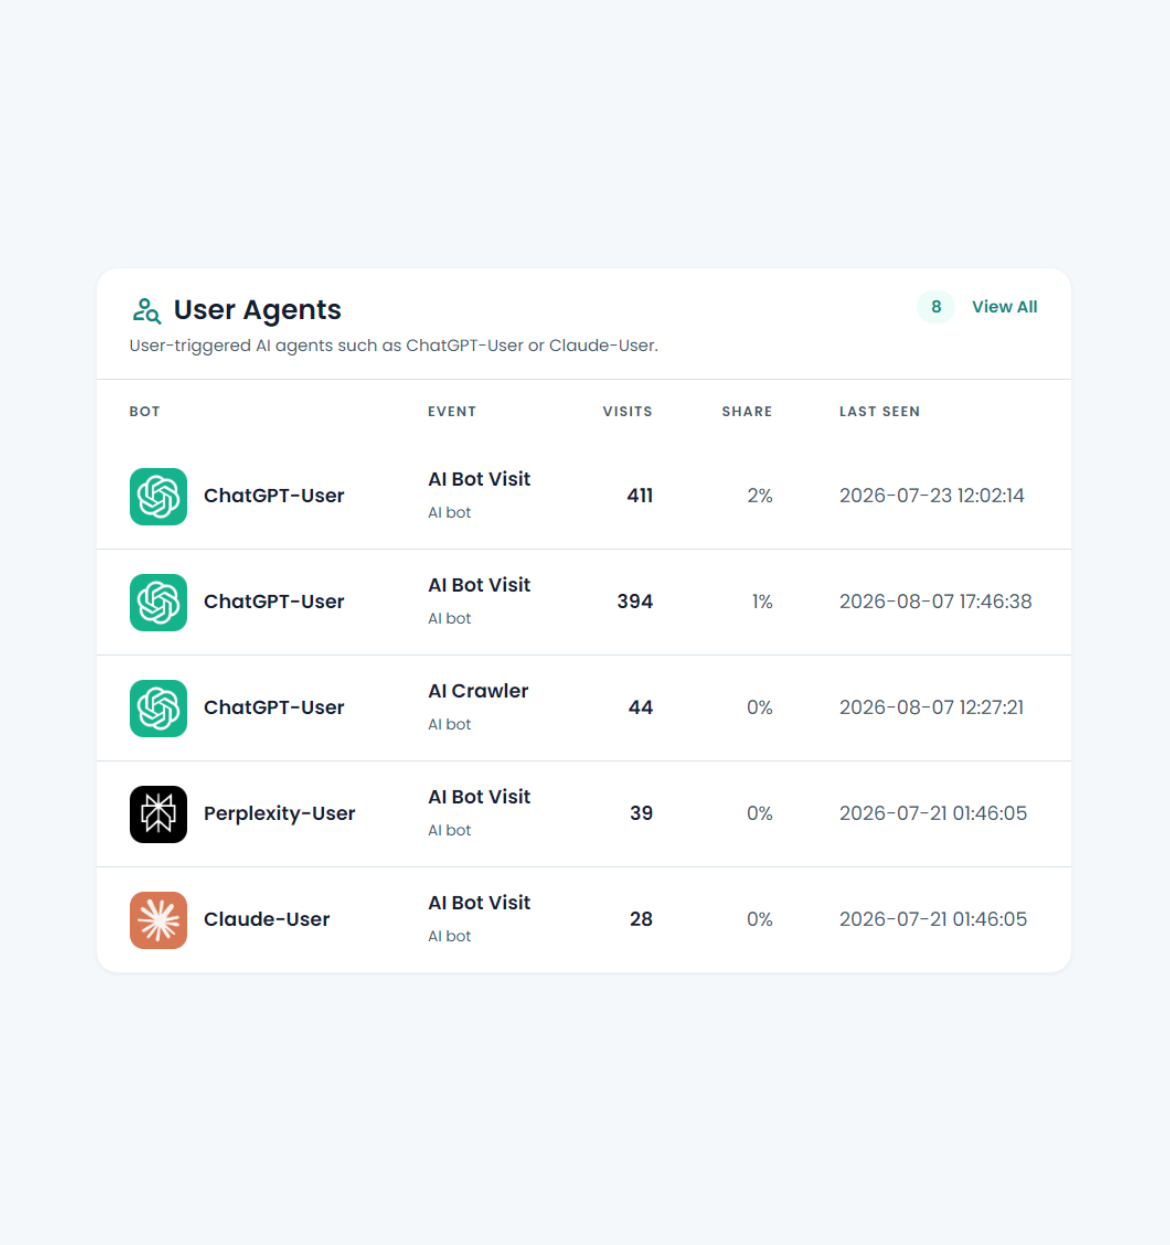
User-triggered vs automated AI activity

Separates AI page retrieval associated with a user action from automated AI crawler activity.

  • User-triggered AI retrieval16.0%
  • Automated AI crawling84.0%

Percentages describe the published activity mix only. They do not prove rankings, citations, training use, or recommendations.

Live study library

Browse SEO, AEO, and GEO case studies

Live Case Study

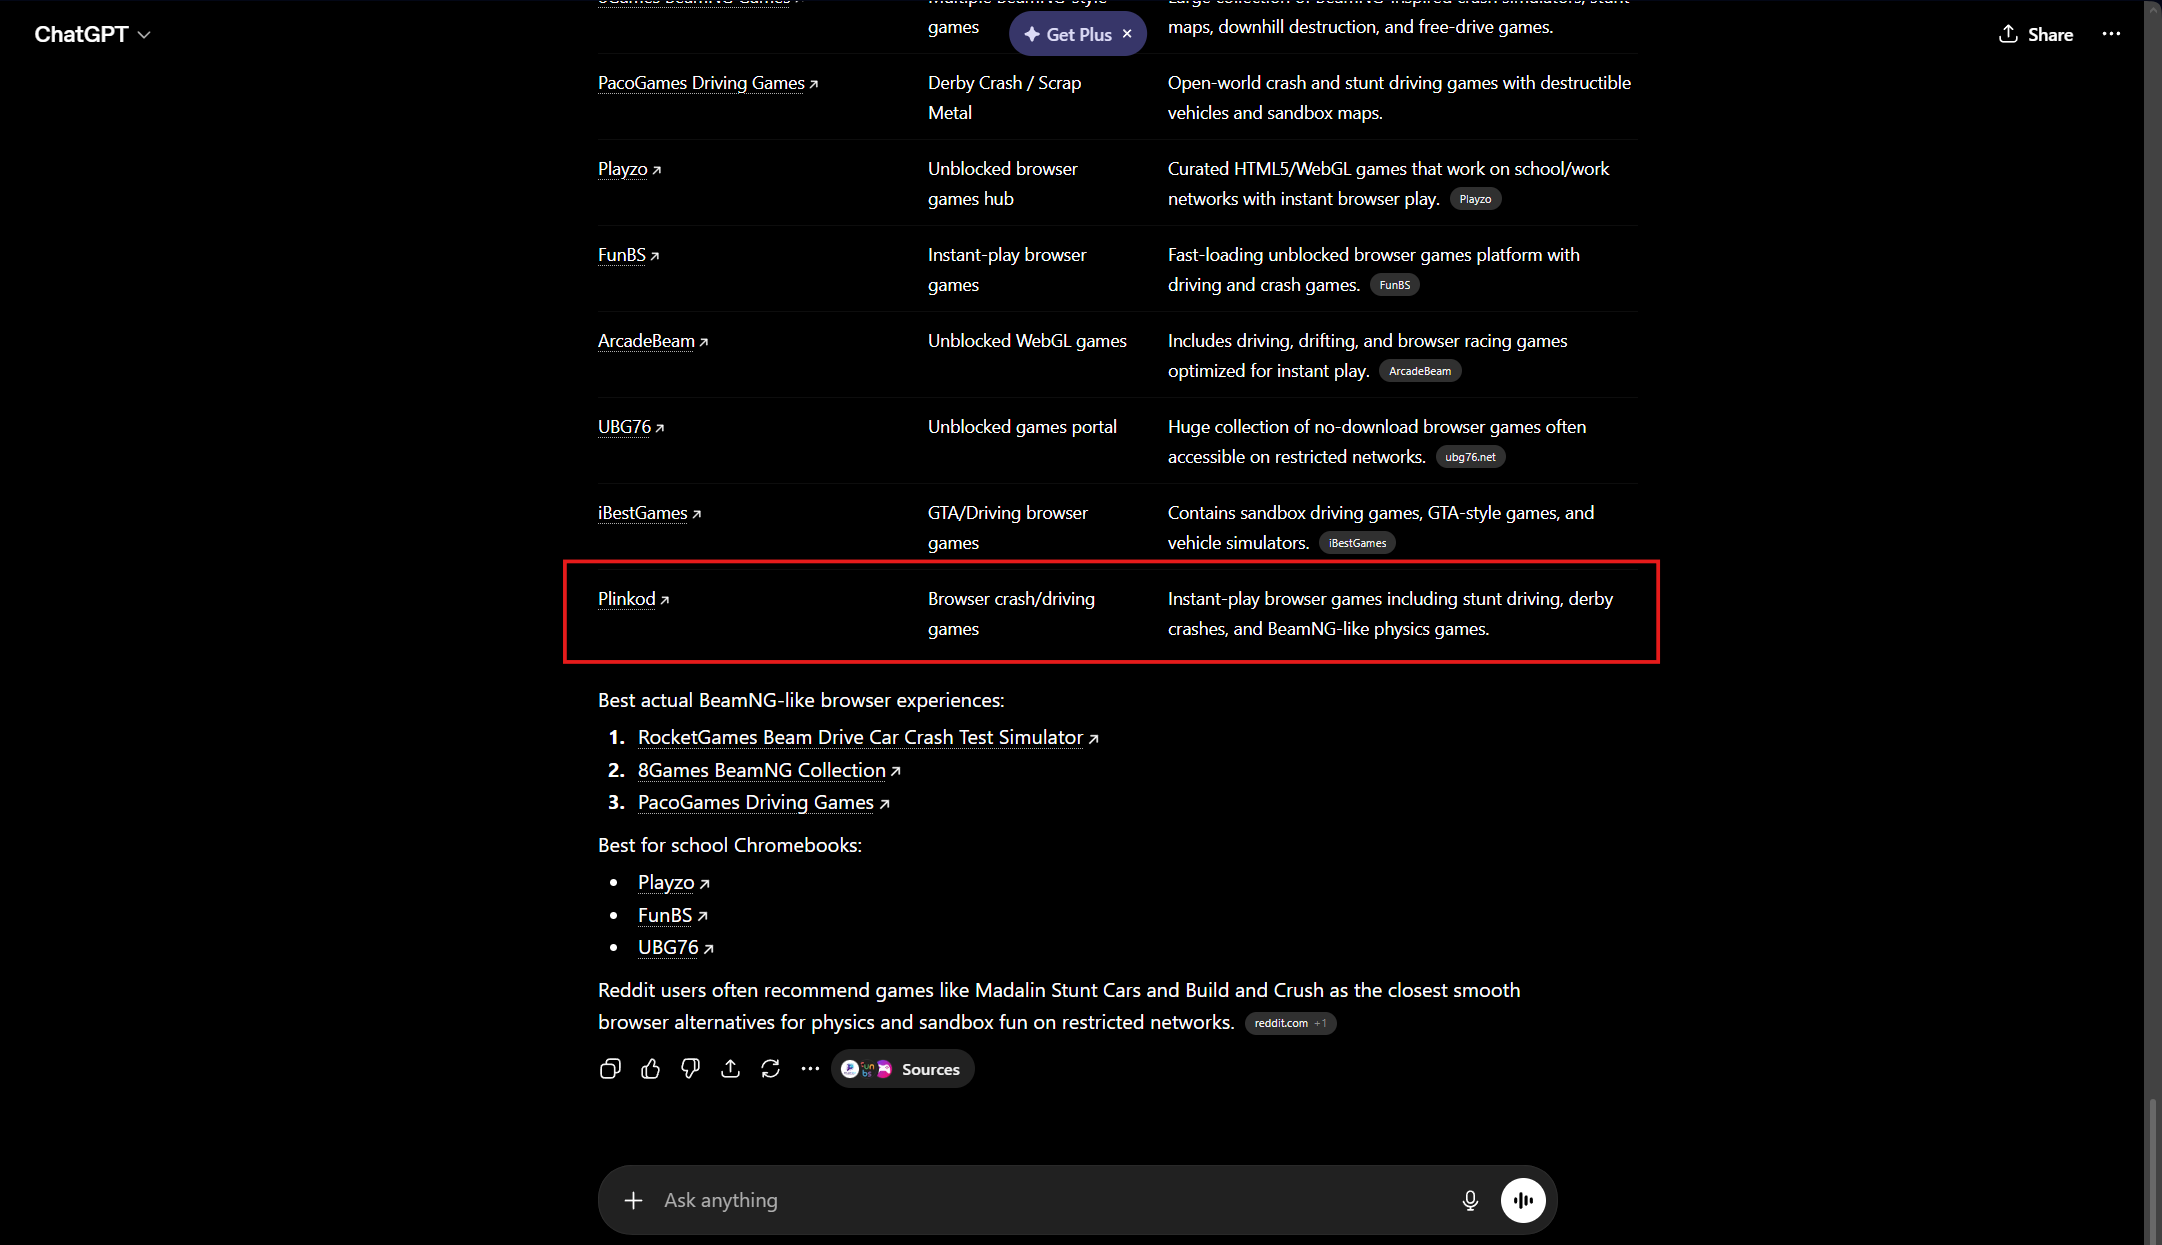
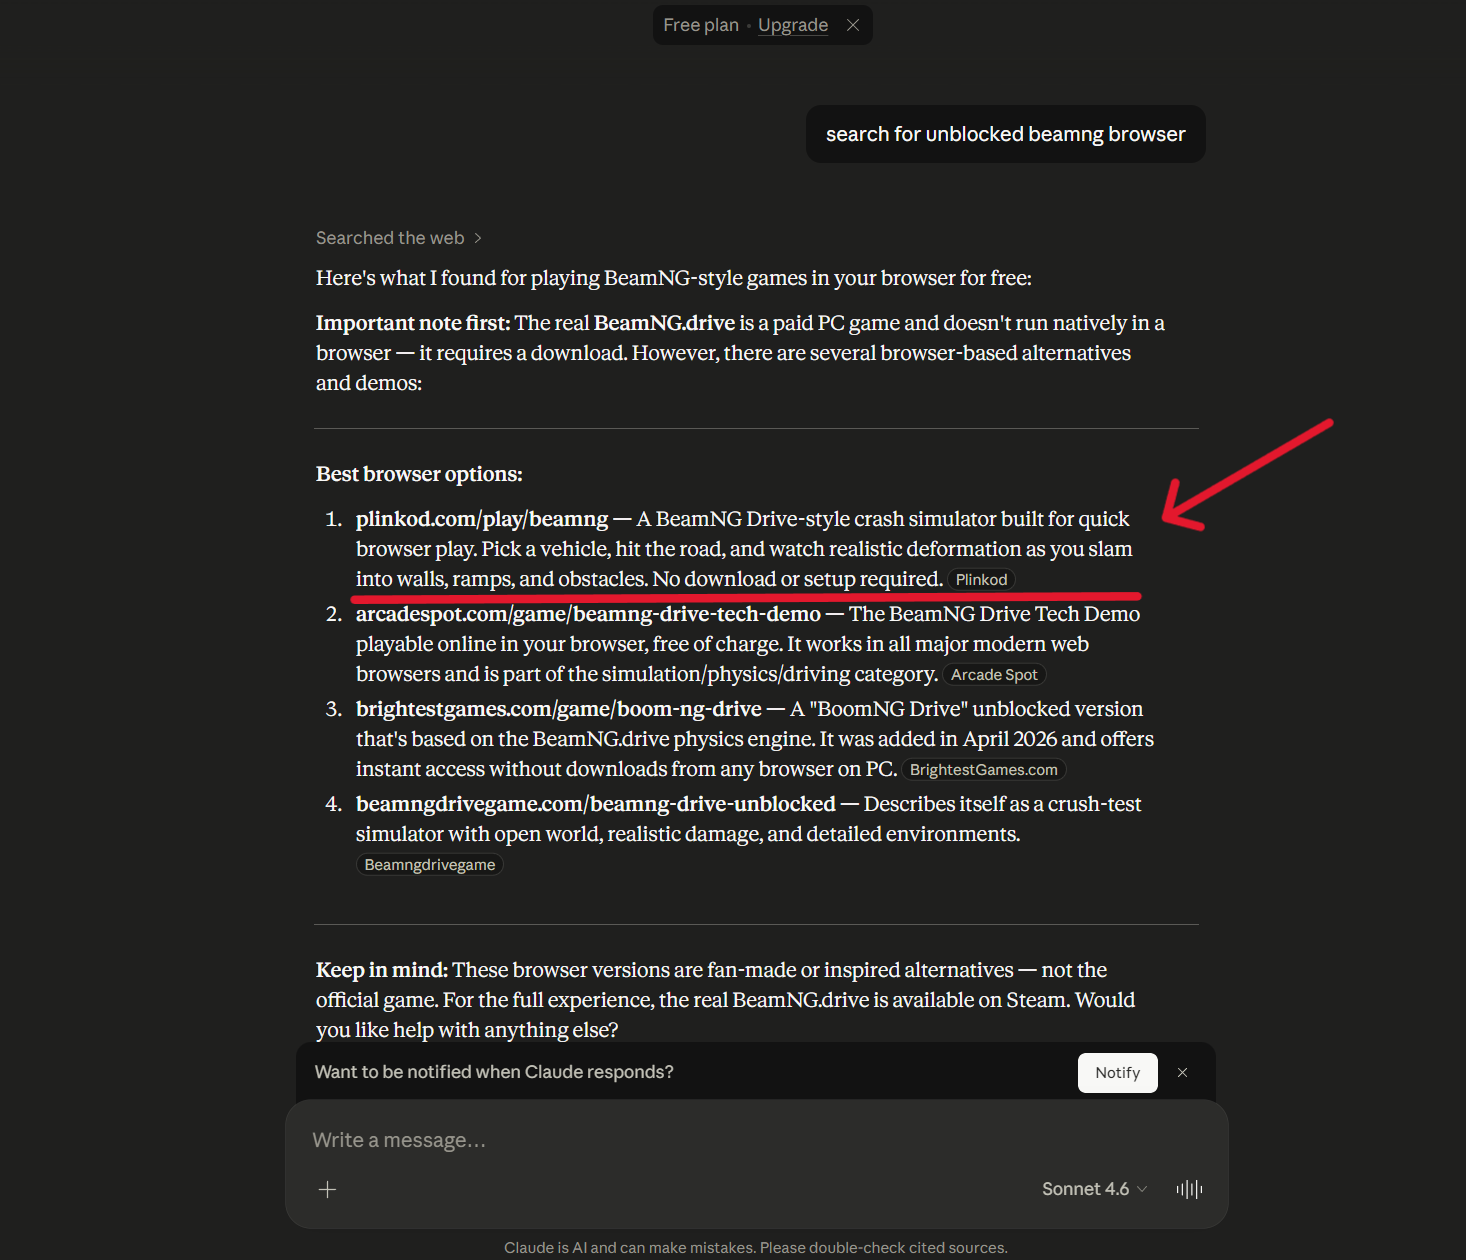
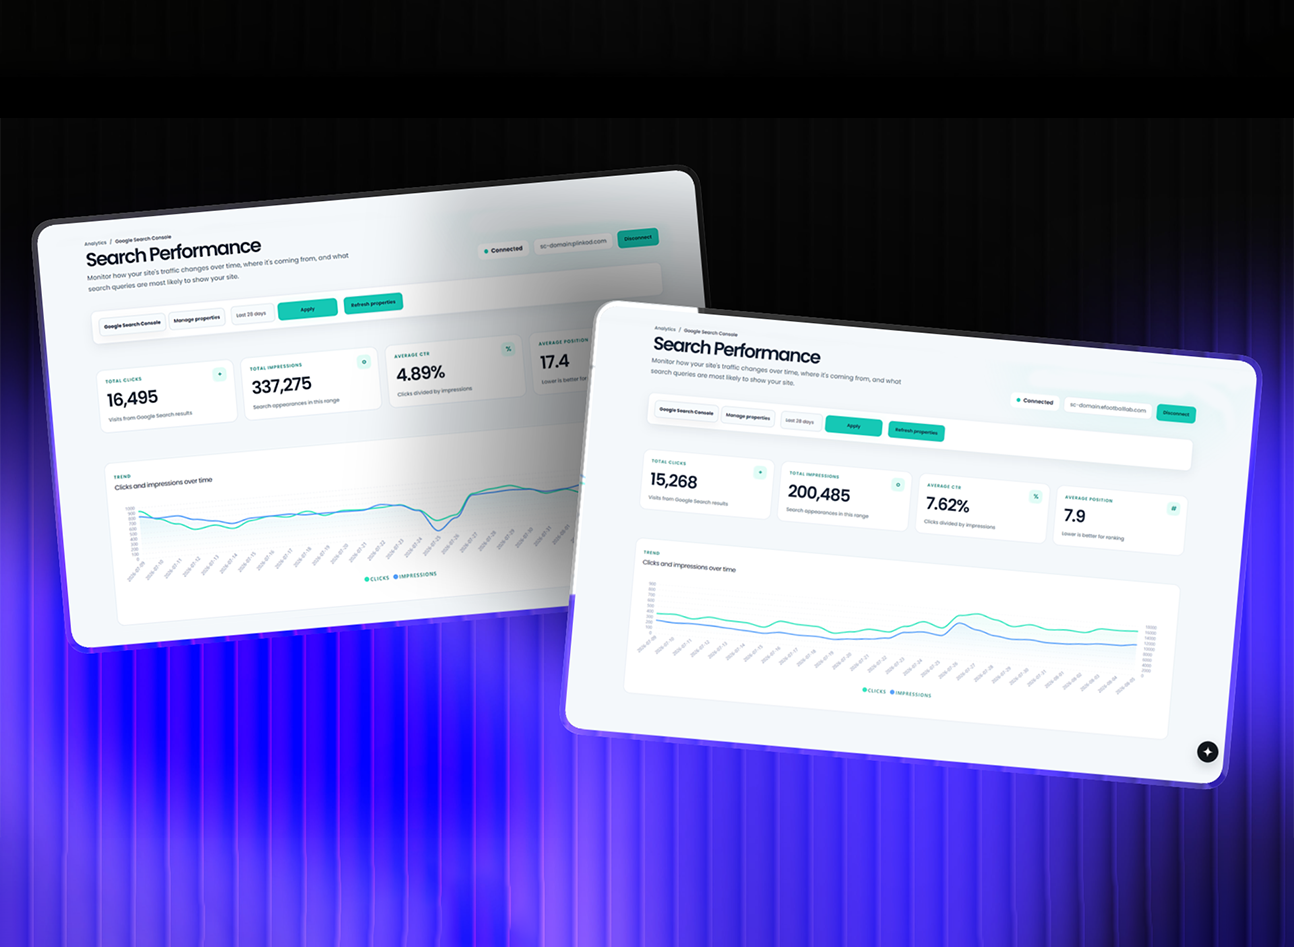
Plinkod AI Visibility Case Study

24,972 attributed visits from AI platforms, including 5,869 from ChatGPT, plus a 97,446-event crawler evidence set with transparent confidence labels.

24,972AI-platform visits
View study
Founder Workflow

eFootballLab Search Opportunity Study

791 attributed visits from AI platforms, with ChatGPT ranking sixth among all referral sources in the supplied export.

791AI-platform visits
View workflow
Founder Workflow

How We Use TruboRankAI on TruboRankAI

A transparent look at how we use our own product data to prioritize pages, improve documentation, and test AI visibility workflows.

6Workflow steps
View workflow
Live case study data

Live AI visibility case studies with real numbers, analytics, and charts

This library is built for people looking for documented AI visibility results—not generic advice. Every study connects real website evidence with a clear SEO, AEO, or GEO workflow.

Real traffic and referral numbers

Review attributed visits and pageviews from AI platforms such as ChatGPT, Claude, Perplexity, and Gemini. Referral traffic is reported separately from crawler requests, so a bot visit is never presented as a human visit or an AI citation.

AI bot and crawler analytics

Analyze how GPT, Claude, Perplexity, spider bots, AI bots, and search bots appear in the latest published activity snapshot. These analytics show access and retrieval patterns while keeping their limitations visible.

Percentage charts and comparisons

Use live percentage charts to compare platform activity, AI bots versus search bots, and user-triggered retrieval versus automated AI crawling. Each chart can be exported as a branded 1000 × 1000 image for reports or social posts.

Documented SEO, AEO, and GEO analysis

Follow the starting point, the action taken, the evidence collected, and the next decision. The studies show how technical SEO, answer-ready content, generative search clarity, and crawler monitoring fit into one measurable workflow.

From data to action

How to use live case study analysis for SEO, AEO, and GEO decisions

A useful case study should help you understand what happened, what the numbers mean, and what can be tested next on your own website.

01

Check the evidence source

Start with the publication date and evidence type. Search Console data, referral exports, crawler logs, and saved answer-engine observations answer different questions and should not be combined into one visibility claim.

02

Compare the live numbers

Use percentages and trend context to see which AI platforms or crawler groups account for the largest share. A change in bot activity can guide investigation, but it does not by itself prove ranking or citation impact.

03

Turn analysis into the next test

Connect the observed signal to a practical action: improve crawl access, clarify a page answer, strengthen entity context, build an intent page, or monitor whether the next published snapshot changes.

Measured portfolio snapshot

AI discovery produced measurable referral traffic.

Across the two owner-operated properties in the supplied referrer exports, AI answer platforms generated 25,763 attributed visits and 2,696 pageviews. These are observed referrals, not estimated visibility.

6,627ChatGPT visits

Attributed across Plinkod and eFootballLab.

2,696AI-referred pageviews

Measured in the two aggregate referrer exports.

2Live web properties

Evidence snapshot manually published 17 September 2026.

Evidence standards

Why these studies are different

AI visibility is still evolving. Search engines, crawlers, and answer engines do not always expose complete information about why a website appears or disappears.

That is why these studies focus on what can be documented: page improvements, crawler activity, Search Console context, observed AI answer appearances, and the actions taken next.

Case study questions

How to read these live AI visibility studies

Short answers about the evidence, charts, and update process used across this case study library.

What is a live AI visibility case study?

It is a documented analysis of a real website using published referral, crawler, search, and answer-engine evidence. Each study separates observed data from assumptions and explains the workflow behind the result.

What do the case study charts measure?

The charts compare published activity as percentages, including GPT, Claude, Perplexity, spider bots, AI bots versus search bots, and user-triggered versus automated AI activity.

How often are the live case study statistics updated?

The statistics update when a reviewed evidence snapshot is published from the TruboRankAI Admin dashboard. The latest publication date is shown beside the charts.

Evidence standards

How we document these studies

We separate what was changed, what was observed, and what cannot yet be attributed with certainty. This keeps each study useful without turning incomplete signals into exaggerated claims.